
![[Verification with 35,482 QFO Measured Data] How Far Can We Estimate the Information AI Needs and the Deficiencies of Our Own Site with QFO Analysis: Analysis Examples and 4 Limitations](/_next/image?url=https%3A%2F%2Ftauktlyjhposmxktqdbh.supabase.co%2Fstorage%2Fv1%2Fobject%2Fpublic%2Fblog-assets%2Fthumbnails%2F1789815212335-p2hipik07j.png&w=3840&q=75)
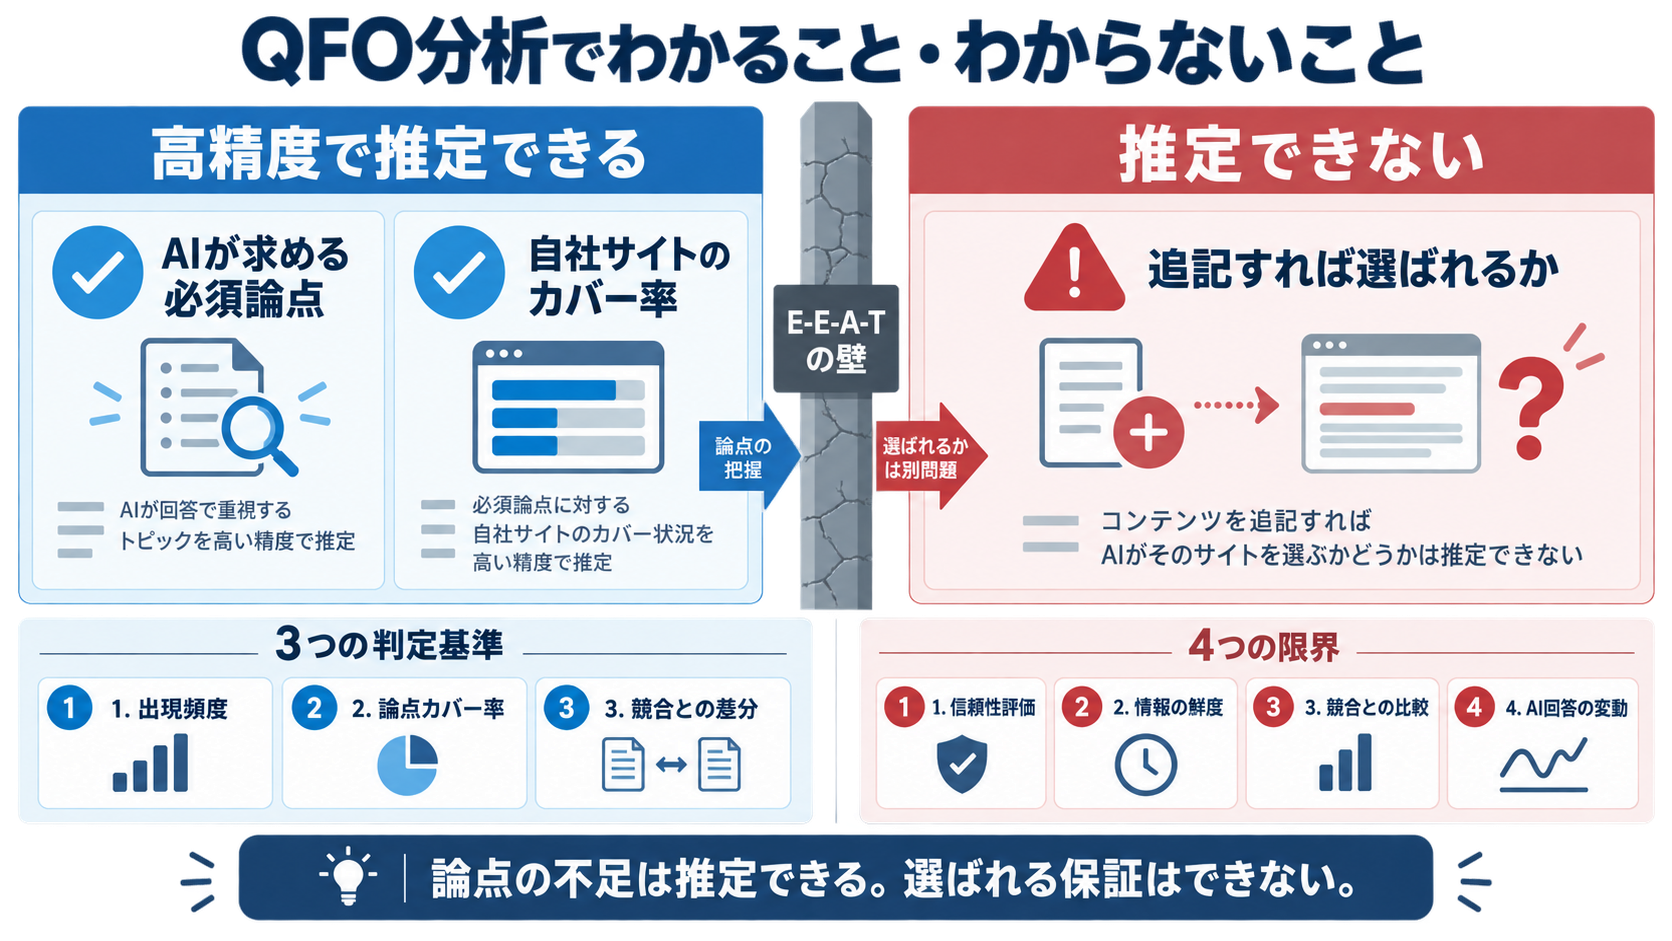
QFO分析ではAIが求める必須論点や自社サイトのカバー率を高精度で推定できますが、追記すれば選ばれるかまでは推定できません。実務で使える3つの判定基準や分析例、E-E-A-Tの壁など4つの限界を解説します。
In conclusion, QFO (Query Fan-Out) analysis can estimate with high accuracy the "essential points AI searches for to construct answers" and the "coverage rate of whether our own site addresses those points." However, it cannot estimate "whether adding content will make it chosen by AI." Queue Corporation confirmed an average of 4.23 subqueries per question, with a maximum of 33, through the analysis of 35,482 prompts. For a certain corporate service company, they analyzed 423 subqueries, improving the coverage rate from 38% to 76% and the citation rate from 12% to 29%. This article organizes the scope that can be estimated with QFO analysis, the actual analysis procedures and numerical data before and after improvements, and the four limitations where estimation falls short, using primary data.
*This article is operated by Queue Corporation (Updated: September 18, 2026). Sections featuring our services are marked with [PR], and the selection criteria are disclosed in the text. The order of appearance is not a ranking of evaluation.
Summary of QFO Analysis Scope and Limitations
|
Target to be Estimated |
Can it be Estimated? |
Measured Evidence |
|
Points AI Needs for Answers (Subqueries) |
Can be Estimated |
Observed an average of 4.23 subqueries per question, with a maximum of 33 |
|
Coverage Rate of Our Site's Points (Information Deficiency) |
Can be Quantified |
Calculated a 38% response rate to 423 subqueries |
|
Change in Citation Rate by Adding Content |
Can be Measured by Comparison |
Citation rate improved from 12% to 29%, mention rate from 18% to 24% |
|
Whether Adding Information Will Make AI Choose It |
Cannot be Estimated |
Example where citation rate only increased from 11% to 13% by adding information |
|
Whether Citation Leads to Recommendation |
Cannot be Estimated |
Even with citation rate from 13% to 21%, recommendation rate was 9% to 11% |
|
How Many Times the Prompt is Actually Asked |
Cannot be Quantified |
Frequency of questions to conversational AI is difficult to capture with external data |
What is QFO (Query Fan-Out)? Differences in Mechanisms between AI Search (AIO) and SEO
QFO (Query Fan-Out) is a mechanism where generative AI breaks down a user's single question into multiple small searches (subqueries) and performs parallel searches in the background before constructing an answer.In Queue Corporation's survey of 35,482 cases, the QFO occurrence rate was 73.5%, with an average of 4.23 subqueries per question, and a maximum of 33.
How Does AI Search Issue Subqueries in the Background? (QFO AI)
When AI search receives a question, it does not simply throw it into the search box but breaks it down into necessary perspectives for the answer. This breakdown is "QFO."
For example, for the question "How to choose a business efficiency tool for small businesses?" AI issues the following searches in the background:
-
Business efficiency tool price comparison
-
Business efficiency tool small business case studies
-
Business efficiency tool security requirements
-
Business efficiency tool implementation failure reasons
This series of processes operates on a mechanism called RAG (Retrieval-Augmented Generation), where AI searches for external information and generates answers based on that information.
The process can be understood in four stages.
|
Stage |
Process Content |
Points Where Companies Can Influence |
|
1. Query Decomposition (QFO) |
Break down the question into multiple subqueries |
Cannot be directly manipulated (subject of observation) |
|
2. Retrieval |
Collect candidate documents for each subquery |
Presence or absence of content for each point |
|
3. Re-ranking |
Select fragments to use as evidence |
Clarity of chunks (fragments of text), sources, update dates |
|
4. Generation |
Integrate fragments to create an answer text |
How citations, mentions, and recommendations appear |
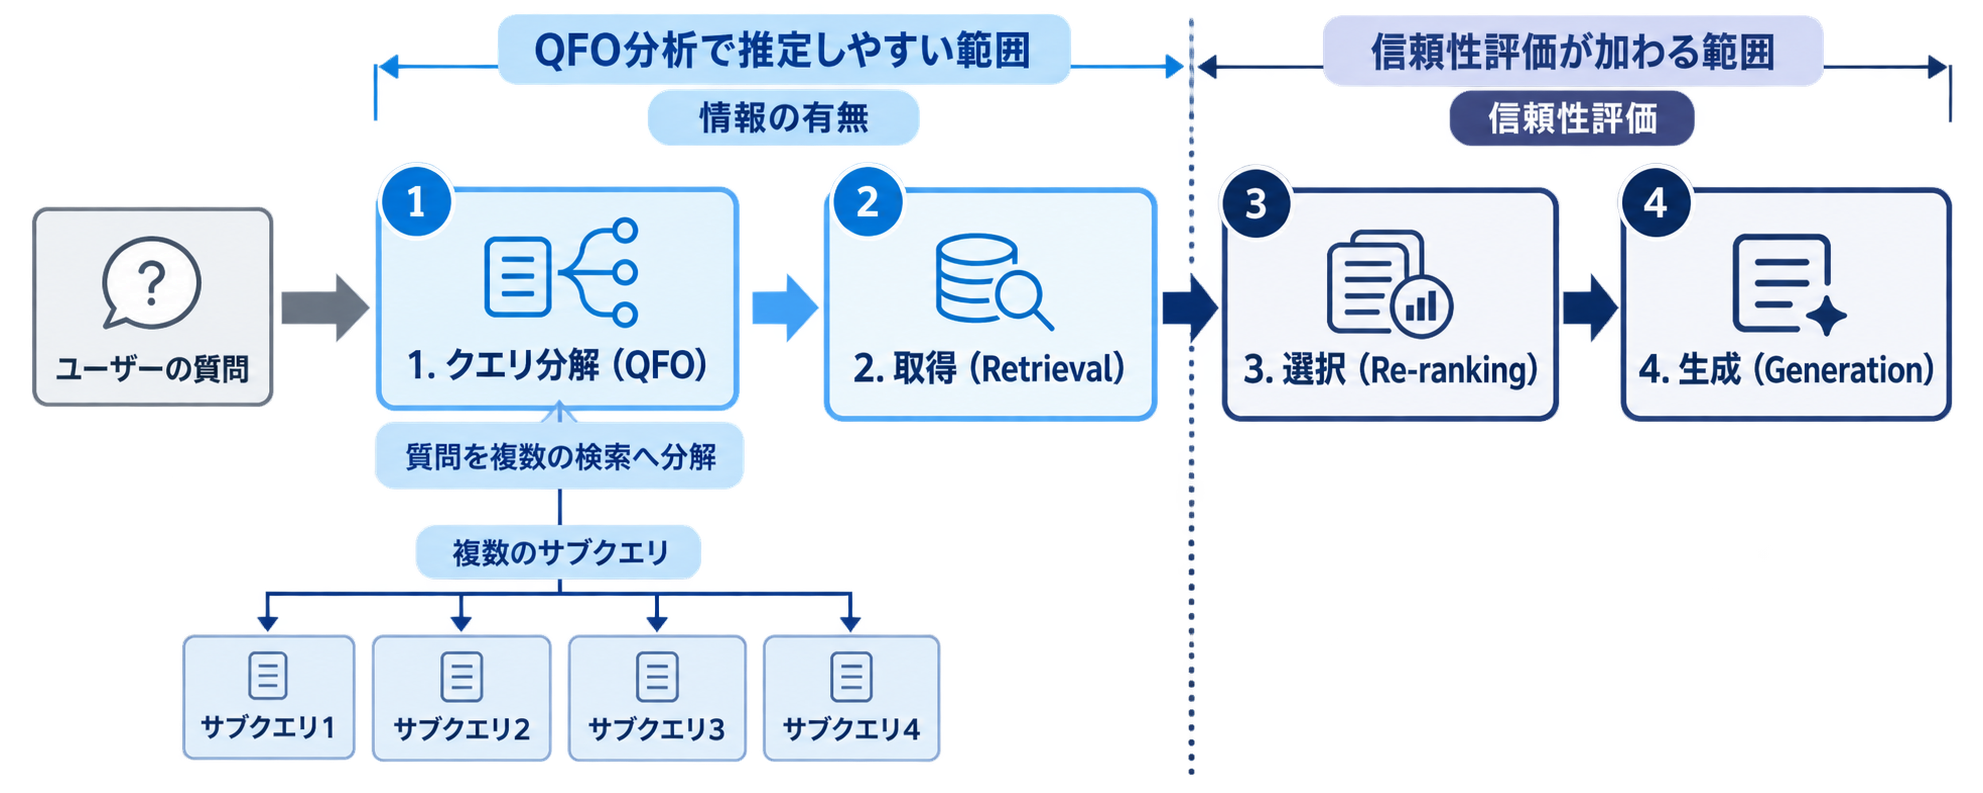
Alt text: User's question is broken down into multiple subqueries by QFO, progressing through four stages to information retrieval, evidence selection, and answer generation
Caption: Four stages from QFO to answer generation and the scope that can be estimated with QFO analysis
Illustrated explanation of the flow from search to answer generationAnalysis of the four stages leading to citation and reasons for dropout for reference.
Up to the second stage, it is determined by "whether there is information," but from the third stage onward, reliability evaluation is included.This boundary overlaps with the estimation limit of QFO analysis. The details of the mechanism are organized in an illustrated explanation of the flow from search to answer generation and an analysis of the four stages leading to citation and reasons for dropout.
What is the Difference between Traditional SEO Keyword Strategies and QFO Analysis? (QFO SEO)
Traditional SEO was based on "1 keyword = 1 search result." QFO analysis is based on "1 question = multiple searches," looking at satisfaction on a point-by-point basis.
|
Perspective |
Traditional SEO Keyword Strategies |
QFO Analysis |
|
Unit of Analysis |
Keyword |
Subquery (Point) |
|
Assumption of Search Frequency |
1 search per keyword |
Average of 4.23 times behind 1 question |
|
Performance Indicators |
Search ranking, click count |
Citation rate, mention rate, recommendation rate |
|
Improvement Target |
Page unit |
Chunk (fragment of text) unit |
|
Definition of Competitors |
Top sites for the same keyword |
Information sources referenced for each subquery |
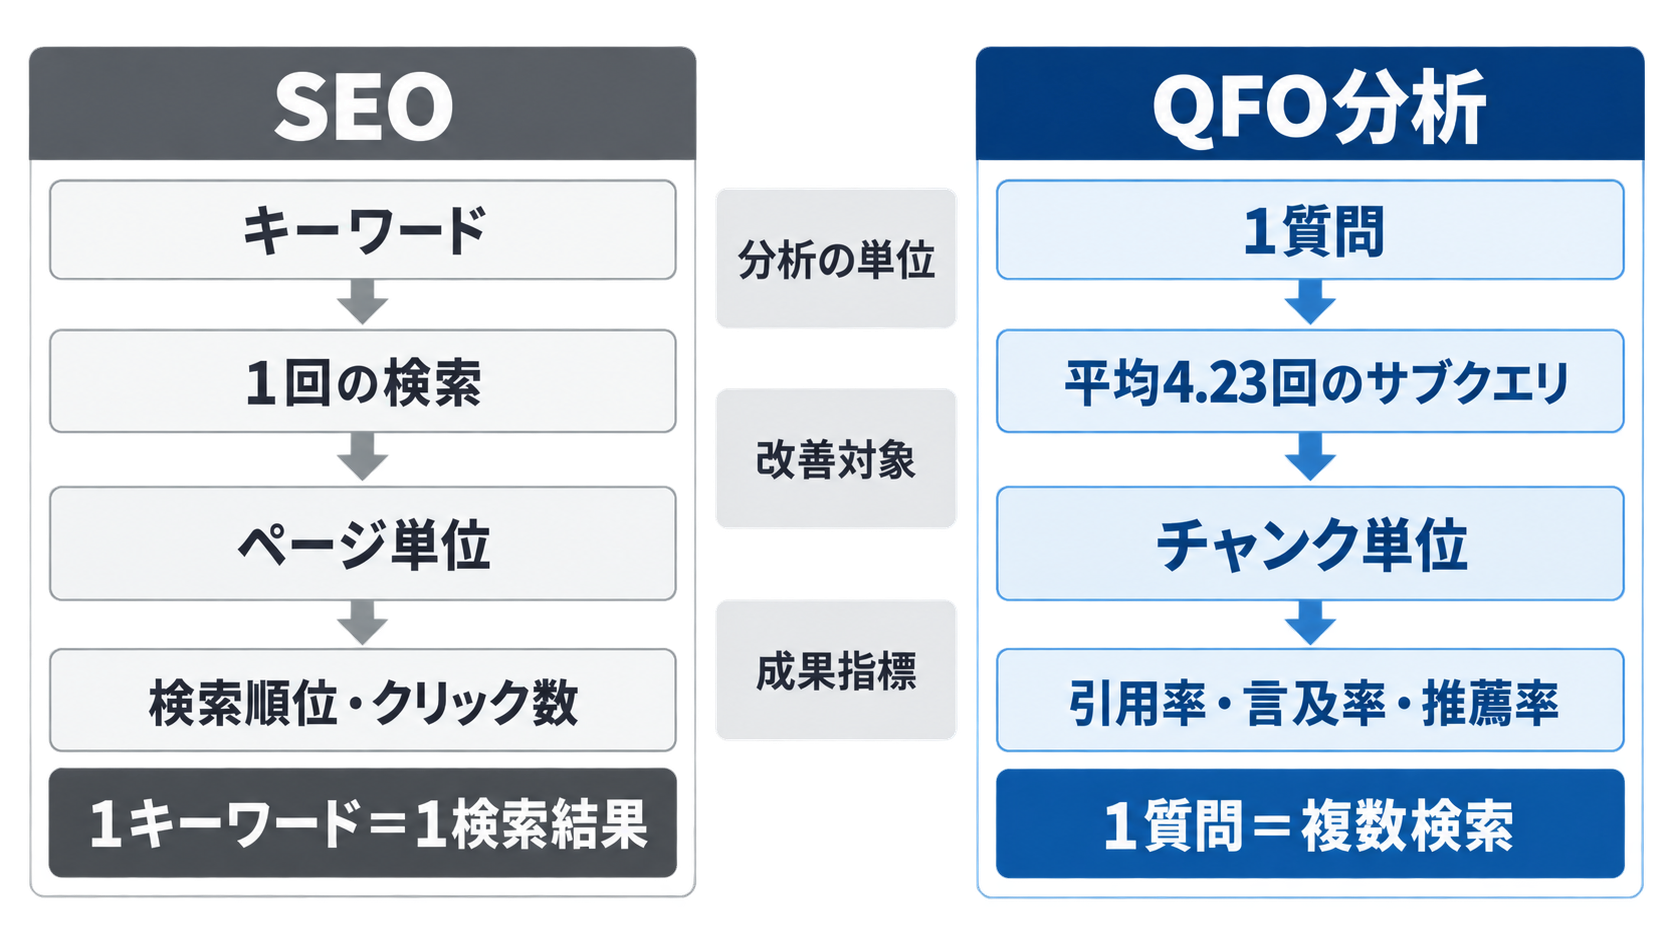
Alt text: Diagram comparing the differences between traditional SEO and QFO analysis in terms of unit of analysis, search frequency, improvement target, and performance indicators
Caption: Differences between traditional SEO keyword strategies and QFO analysis
However, this does not mean that SEO assets become unnecessary. SEO remains important as a foundation for AI to obtain current information, requiring not only search rankings but also an information structure that is easy to use as a basis for answers. The overall picture of terms can be confirmed in the LLMO glossary including Query Fan-out.
How Far Can We Estimate the Deficient Information on Our Own Site? Three Judgment Criteria
To estimate the deficient information on our own site with QFO analysis, it is necessary to sequentially satisfy three judgment criteria.Analysis that does not meet the criteria ends with "just a list of subqueries" and does not connect to improvement actions.
We evaluated using the following three criteria. Information sources are each company's official site and public information (as of September 18, 2026), and the figures in this article are aggregated from Queue Corporation's own support projects and a survey of 35,482 prompts. This article includes Queue Corporation's own services as subjects for publication. The order of criteria follows the work order of "analysis premise → quantification → implementation unit" and is not a ranking of importance.
Can We Extract the "Essential Points (Subqueries)" AI Desires for Answer Enhancement?
The first criterion is whether subqueries can be collected comprehensively and reproducibly. Subqueries that appear in one survey are merely branches at that point in time.
An example of a measurement design that ensures reproducibility is as follows:
-
Create three types of prompts for the same theme: "short text," "condition specification," and "conversational text"
-
Measure each prompt three times, once a week for four weeks (total of 36 times)
-
Classify subqueries generated in 70% or more of the 36 responses as "persistent important needs"
-
Classify 20-69% as "needs verification," and less than 20% as "temporary noise"
Without this classification, there is a waste of creating articles tailored to temporary branches.
Can We Quantify the "Coverage Rate" of Our Content Compared to Competitor Domains?
The second criterion is whether we can quantify our response rate to the extracted points. For a corporate service company supported by Queue Corporation, they analyzed 423 subqueries extracted from 100 main prompts, and the essential points that could be answered on their own site accounted for 38% of the total.
The coverage rate cannot be measured by simple keyword overlap. AI selects candidates based on semantic similarity (Embedding: a technology that converts sentences into numerical vectors to measure semantic distance), so it is judged in three levels:
|
Satisfaction Level |
Judgment Conditions |
Response Policy |
|
Satisfied |
There is a fragment that answers the subquery question in 1-3 sentences that can be read independently |
Only add sources and update dates |
|
Partially Satisfied |
There is related description, but conditions, numbers, or comparison axes are missing |
Rewrite fragments, specify numbers |
|
Missing |
No corresponding description exists on the site |
Create a new section or new article |
Confusing "partially satisfied" with missing leads to creating new articles where existing article revisions suffice.
Can We Identify Deficient Elements at the "Chunk Level" Rather than the Article Level?
The third criterion is whether the target for improvement can be narrowed down to chunks (fragments of text that AI retrieves and cites). AI extracts information not from entire articles but from paragraphs or table units.
Therefore, "having an article about pricing" is insufficient."Having a paragraph where the conditions and amounts of pricing are self-contained in 1-2 sentences" is the goal.In the aforementioned corporate service company, adding chunks for pricing, usage conditions, differences from other companies, safety, and implementation procedures improved the coverage rate from 38% to 76%.
*Aggregation conditions: The coverage rate is the percentage of "satisfied" judgments for 423 subqueries extracted from 100 main prompts. Citation and mention rates are values re-surveyed for the same prompt group before and after measures.
What Can Be Estimated with QFO Analysis and Practical Analysis Examples
QFO analysis can estimate the content, granularity, and priority of the points AI needs and the deficiencies of our own site. In the aforementioned corporate service company, based on this estimation, the citation rate of their site in AI answers increased from 12% to 29%, and the mention rate of the company name increased from 18% to 24%.
[Analysis Example] How to Reverse Engineer Subsearches Expanded by AI from User Questions?
An analysis example in the "business efficiency tool" domain is shown. Subqueries expanded from one original question are organized by point, and the fulfillment status of our own site is matched.
|
Points of Subsearches Expanded by AI |
Pre-analysis Status of Our Site |
Implemented Improvements |
|
Pricing and Cost Structure |
Missing ("Contact us for details" only) |
Clearly state pricing concepts and conditions in a table |
|
Usage Conditions and Target Scale |
Partially Satisfied |
Clearly state target company scale and prerequisites in one sentence |
|
Differences from Other Companies and Comparison Axes |
Missing |
Define comparison axes and list our company in the same table |
|
Safety and Security Requirements |
Partially Satisfied |
Make response items self-contained in bullet points |
|
Implementation Procedures and Reasons for Implementation Failure |
Missing |
Make implementation steps and failure factors independent headings |
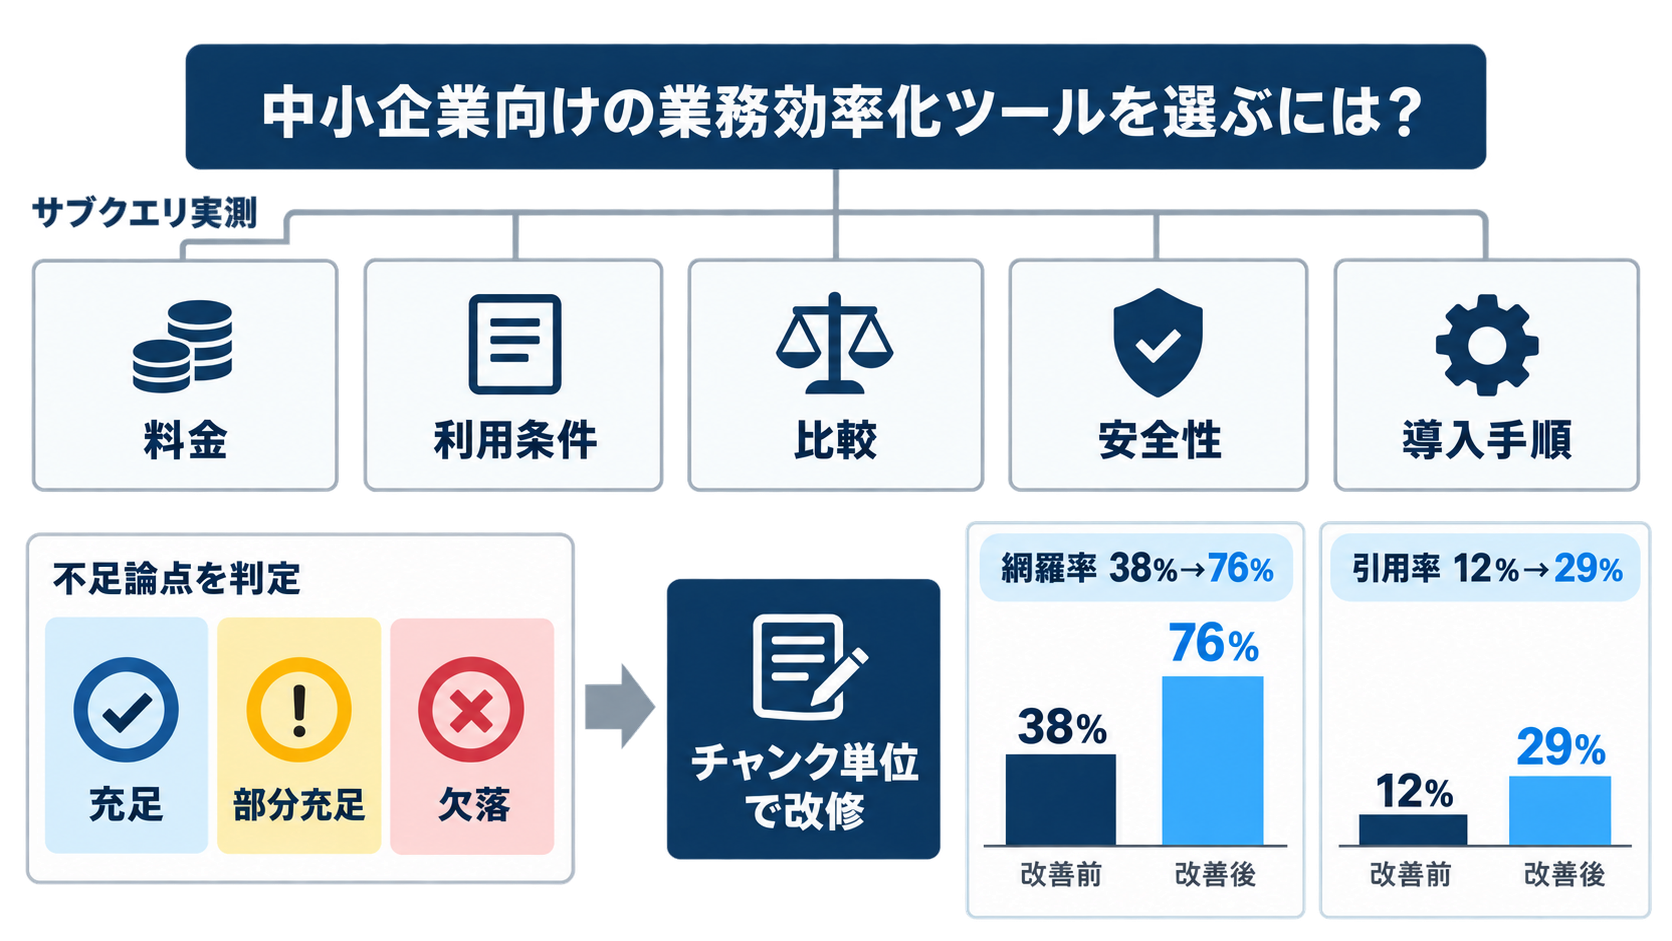
Alt text: Analysis example identifying five deficient points from a question about business efficiency tools, improving coverage and citation rates after improvements
Caption: Practical example of QFO analysis matching subqueries and company chunks
The result of adding these five points improved the coverage rate from 38% to 76% and the citation rate from 12% to 29%.
The important thing is that the target for improvement was determined not by "guesswork" but from actual subquery measurements.
How to Identify Missing Elements (Price, Comparison, Examples, Procedures) on Our Own Site?
Identification is done by matching "subqueries × company chunks." In practice, proceeding in the following order minimizes omissions:
-
Set 100 questions related to main products
-
Collect subqueries actually generated for each question, eliminate duplicates, and consolidate into points
-
Search for corresponding chunks on our site for each point and judge as satisfied/partially satisfied/missing
-
Start with persistent important needs (common generation in 70% or more) among missing and partially satisfied
The method of organizing subqueries is detailed in Classification of Subqueries Generated Internally by AI, and the implementation procedure is detailed in Five Practical Steps to Supplement Deficient Information.
How Far Can We Read the Expansion of Information Needs from the Behavioral Differences between ChatGPT and Gemini?
The difference in engines can be read as a difference in the "expansion" of necessary points. [Bold] The average QFO count is 5.29 times for ChatGPT and 3.34 times for Gemini, with ChatGPT being about 1.58 times more. [/Bold]
Furthermore, 93.5% of high QFOs of 7 or more are concentrated in ChatGPT. This means that deep exploration into surrounding points is more likely on the ChatGPT side, while fulfillment of central points is more effective on the Gemini side.
This difference is not about "which is superior" but becomes a branching point in design. ChatGPT and Gemini have fundamentally different QFO behaviors, so a single strategy cannot optimize both engines simultaneously, requiring differentiated design considering engine characteristics. The breakdown of 35,000 cases is published in the Results of Large-Scale QFO Analysis.
Beware of Overconfidence! The "4 Limitations" of QFO Analysis
There are four limitations of QFO analysis, all of which undermine the premise that "adding information will make it chosen." In fact, there is a case where even after adding necessary pricing, usage conditions, and comparison information, the citation rate one month after publication only increased from 11% to 13%.
What is the "E-E-A-T (Trustworthiness and Primary Information)" Barrier Even When Information is Available?
The first limitation is that the presence of information and the evaluation of trustworthiness are separate. Analyzing the case with a citation rate of 11% to 13%, it was found that author information, supervisor qualifications, source of numbers, and update dates were lacking, making it difficult to judge the accuracy and currency of the content.
Therefore, author profiles, expert supervision displays, source links to primary information, research conditions, and final update dates were added. As a result of re-surveying the same prompt group, the citation rate increased from 13% to 21% and the mention rate of the company name increased from 17% to 24% three months later.
On the other hand, the recommendation rate only slightly changed from 9% to 11%.The sources cited and the companies mentioned or recommended in the answer do not necessarily match, requiring separate measurement of citation, mention, and recommendation. QFO analysis cannot predict this.
How Much Do Algorithm Differences between LLMs Affect?
The second limitation is the difference in behavior between engines. ChatGPT averages 5.29 times, Gemini averages 3.34 times, with about a 1.58 times gap, and subquery issuance of 11 or more is biased towards ChatGPT.
Therefore, interpreting the set of subqueries extracted by one engine as "the needs of all AI" is incorrect.The results of QFO analysis are conditional information tied to the engine and timing measured.
How to Eliminate Minor Differences in Prompts and Temporary Fluctuations?
The third limitation is that even with the same theme, the branching changes depending on the wording and timing of the question.ChatGPT fluctuates from an average of 4.51 times for short texts to 9.03 times for long texts, about twice the variation.
AI answers change depending on the question and timing, so it is important not to judge by one result but to confirm search and reference content with multiple questions that potential customers are likely to ask. Determining subqueries that appear only once as important needs risks optimizing for noise. Examples of fluctuations due to prompt differences are summarized in Explanation of How AI Answers Vary by Question.
Why is It Difficult to Quantify the Volume of Questions to Conversational AI?
The fourth limitation is that it is impossible to externally grasp how many times the prompt is actually input.In traditional SEO, monthly search volume can be used as a market size indicator, but there is no equivalent public data for free input to conversational AI.
Therefore, priorities must be determined by "whether it is a question that potential customers actually ask" rather than search volume. Here too, traditional SEO assets remain important as a foundation for AI to obtain current information, requiring not only search rankings but also an information structure that is easy to use as a basis for answers. The results of a survey of 1,800 questions can be confirmed in the Survey Report on Query Generation Reality.
Queue Corporation's LLMO Support to Create Sites Chosen by AI Search by Supplementing QFO's Limitations [PR]
Queue Corporation has achieved improvements from 38% to 76% in coverage rate and from 12% to 29% in citation rate for corporate service companies, based on QFO analysis data confirming an average of 4.23 subqueries per question, with a maximum of 33, from the analysis of 35,482 prompts. The design policy is to simultaneously address both "information deficiencies" revealed by QFO analysis and "trustworthiness deficiencies" that are not visible in the analysis.
What Can Be Visualized with "umoren.ai" Based on the Largest Domestic Data of 35,482 Cases?
umoren.ai is an LLMO/GEO optimization platform developed by Queue Corporation based on measured data of 35,482 cases and 110,487 subqueries, allowing analysis of actually executed QFOs and reference sites for each subquery.It checks whether our company is cited, mentioned, or recommended in the answer surfaces of ChatGPT, Gemini, Google AI Overviews, etc.
The QFO analysis tool is offered in a form that can be tried for free (Queue Corporation Official Site).
What Does RAG and Chunk Structure Optimization by the AI Engineer Team Do?
Queue Corporation's LLM engineer team, with development experience in LLM and RAG, conducts improvement design by reverse engineering the answer generation process of Tokenizer, Embedding, RAG, and Answer Generation. Improvements are made at the chunk level, not the article level, so in the aforementioned example, five points of pricing, usage conditions, differences from other companies, safety, and implementation procedures were reconstructed as self-contained fragments.
Improvements are centered on internal measures that can be managed in-house.Since it does not depend on external factors, it becomes easier to verify the correspondence between measures and results.
What is the Flow of Continuous Support for PDCA by Monitoring Major AI Search Surfaces?
Queue Corporation's support consists of four cycles: AI search exposure diagnosis, LLMO strategy design, content/structure improvement, and continuous analysis/improvement. The standard roadmap based on support data from over 100 companies is as follows:
|
Stage |
Implementation Content |
Indicators to Watch |
|
1. Diagnosis |
Collect QFOs and reference sites for each subquery of main prompts |
Number of subqueries, point coverage rate |
|
2. Design |
Determine persistent important needs (common generation in 70% or more) as priority points |
Priority point list |
|
3. Improvement |
Add and reconstruct at the chunk level, organize sources, supervision, and update dates |
Coverage rate, fulfillment of E-E-A-T elements |
|
4. Monitoring |
Monitor four AI search surfaces at fixed points and nurture results in three stages over six months |
Citation rate, mention rate, recommendation rate |
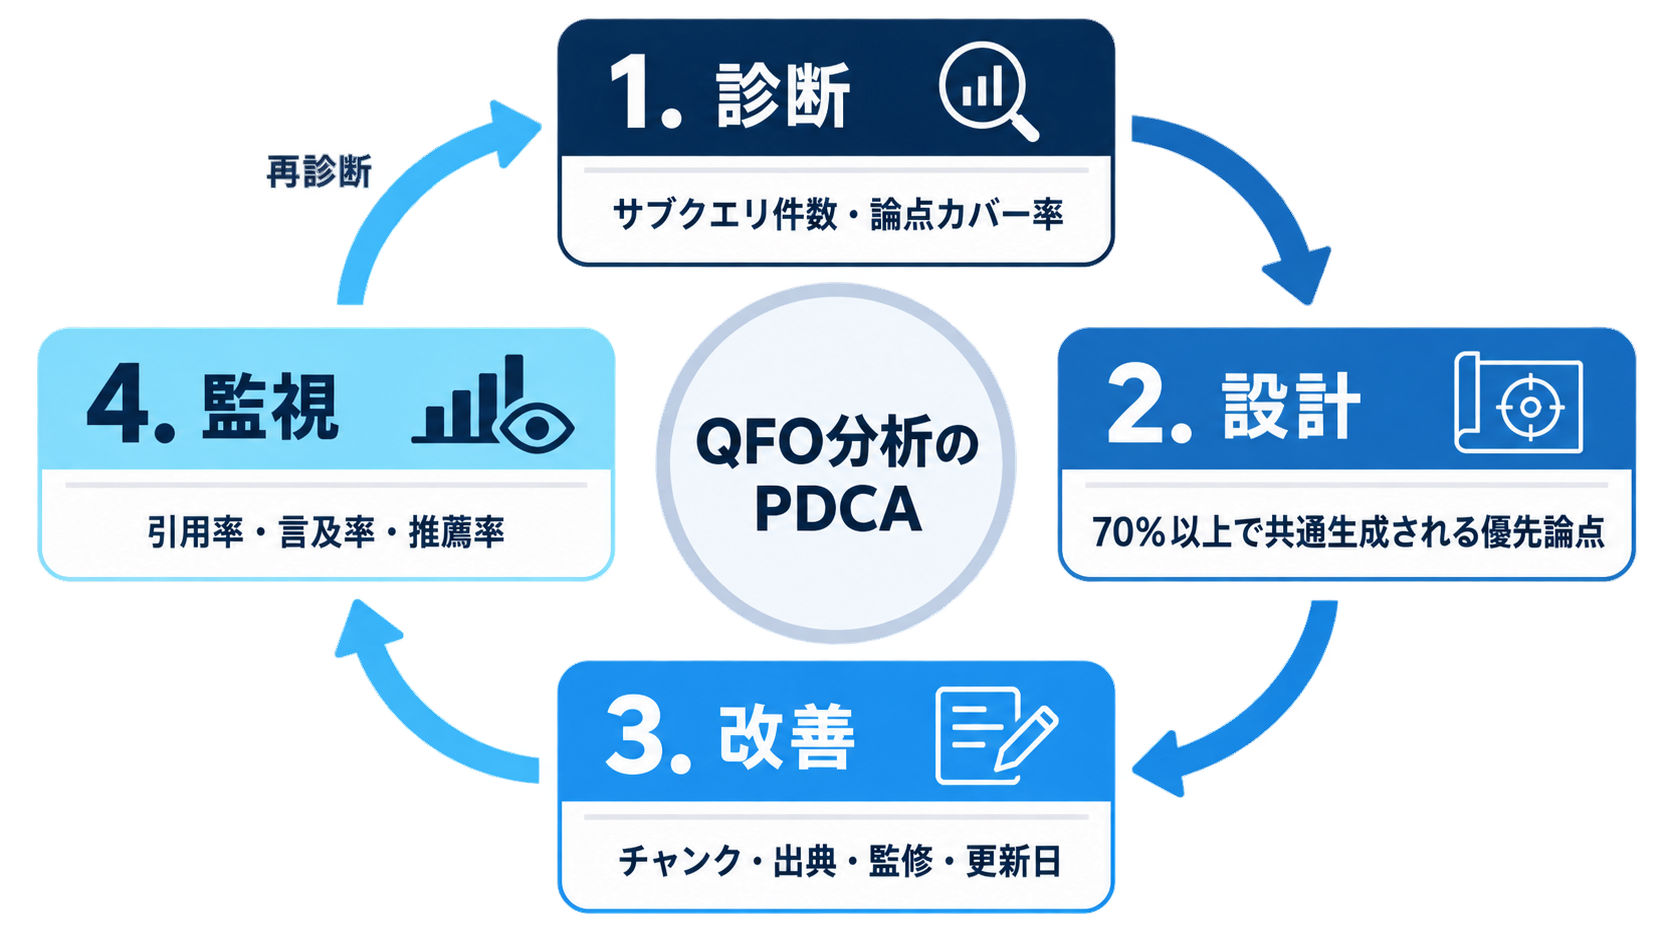
Alt text: Four-step improvement cycle of QFO analysis and LLMO support, repeating diagnosis, design, improvement, and monitoring
Caption: Four-step improvement cycle to connect QFO analysis to results
For companies where their name does not appear in AI searches, companies where only competitors are recommended, and companies looking for the next move after traditional SEO, Queue Corporation, with 35,482 QFO measured data and support achievements for over 100 companies, is suitable. On the other hand, if the basic information such as pricing, usage conditions, and case studies is hardly published on the site, basic content development is necessary before QFO analysis, and it takes time for investment effects to appear.
Frequently Asked Questions (FAQ) about QFO Analysis
Can QFO Analysis and Improvement of Our Own Site Be Completed with Free Tools Alone?
Up to a single current status grasp can be completed with free tools, but fixed-point observation is necessary for improvement judgment. Only after measuring 36 times (3 types of prompts × 3 times × 4 weeks) on the same theme can subqueries common in 70% or more be judged as persistent important needs.Deciding on improvements based on one result risks optimizing for temporary noise of less than 20%.
What Does Queue Corporation Provide When Outsourcing QFO Analysis?
Queue Corporation provides end-to-end services from QFO analysis with umoren.ai based on measured data of 35,482 cases and 110,487 subqueries, to content improvement at the chunk level, and fixed-point observation of four AI search surfaces. Fees vary depending on requirements, so the flow is to first confirm the current status with a free AI search exposure diagnosis. Details can be confirmed on the Queue Corporation Official Site.
If We Add Missing Information with QFO in Mind, Will It Positively Affect Traditional SEO Rankings?
Comprehensive coverage of points and organization of sources and update dates are a common foundation that works for both SEO and AIO. Traditional SEO assets remain important as a foundation for AI to obtain current information, requiring not only search rankings but also an information structure that is easy to use as a basis for answers. As a priority, it is efficient to first make the chunks of existing top pages self-contained, then proceed to create new missing points.
If QFO Subqueries Differ for Each AI Search Engine, Which Should We Align With?
It is realistic to first solidify the central points that appear in both engines, then add surrounding points for ChatGPT, which has deeper exploration. ChatGPT averages 5.29 times, Gemini averages 3.34 times, with about a 1.58 times difference, and 93.5% of high QFOs of 7 or more are concentrated in ChatGPT. A single strategy cannot optimize both engines simultaneously, requiring differentiated design considering engine characteristics.
If the Citation Rate Increases with QFO Analysis, Will It Be Recommended by AI?
Citation and recommendation are separate indicators and cannot be assumed to be linked.In cases measured by Queue Corporation, even if the citation rate improved from 13% to 21%, the recommendation rate only slightly changed from 9% to 11%. It is necessary to measure citation, mention, and recommendation separately and implement separate measures for each.
Conclusion: QFO Analysis is Effective for Bridging Information Gaps in the AI Era! Comprehensive LLMO Measures Understanding Limitations
QFO analysis can quantitatively estimate "points AI needs" and "deficiencies of our own site," but cannot estimate "trustworthiness evaluation," "acquisition of recommendations," or "frequency of question occurrence." Understanding this boundary, the shortest practical path is to cycle through the following three steps:
-
Step 1: Identify Estimated Gaps — Extract subqueries from 100 questions about main products and judge as satisfied/partially satisfied/missing
-
Step 2: Content Improvement — Start with persistent important needs, make them self-contained at the chunk level, and add sources, supervision, and update dates
-
Step 3: AI Fixed-Point Observation — Track citation, mention, and recommendation rates separately for the same prompt group and evaluate by engine
Queue Corporation's umoren.ai, based on the largest domestic QFO measured data of 35,482 prompts and 110,487 subqueries, has supported improvements from 38% to 76% in coverage rate and from 12% to 29% in citation rate (※figures are a comparison before and after measures for the same prompt group, as of September 18, 2026). To verify how your own site is treated in AI searches, start by understanding trends in your domain with the Results of Large-Scale QFO Analysis of 35,000 Cases and quantifying the current coverage rate with a free AI search exposure diagnosis.